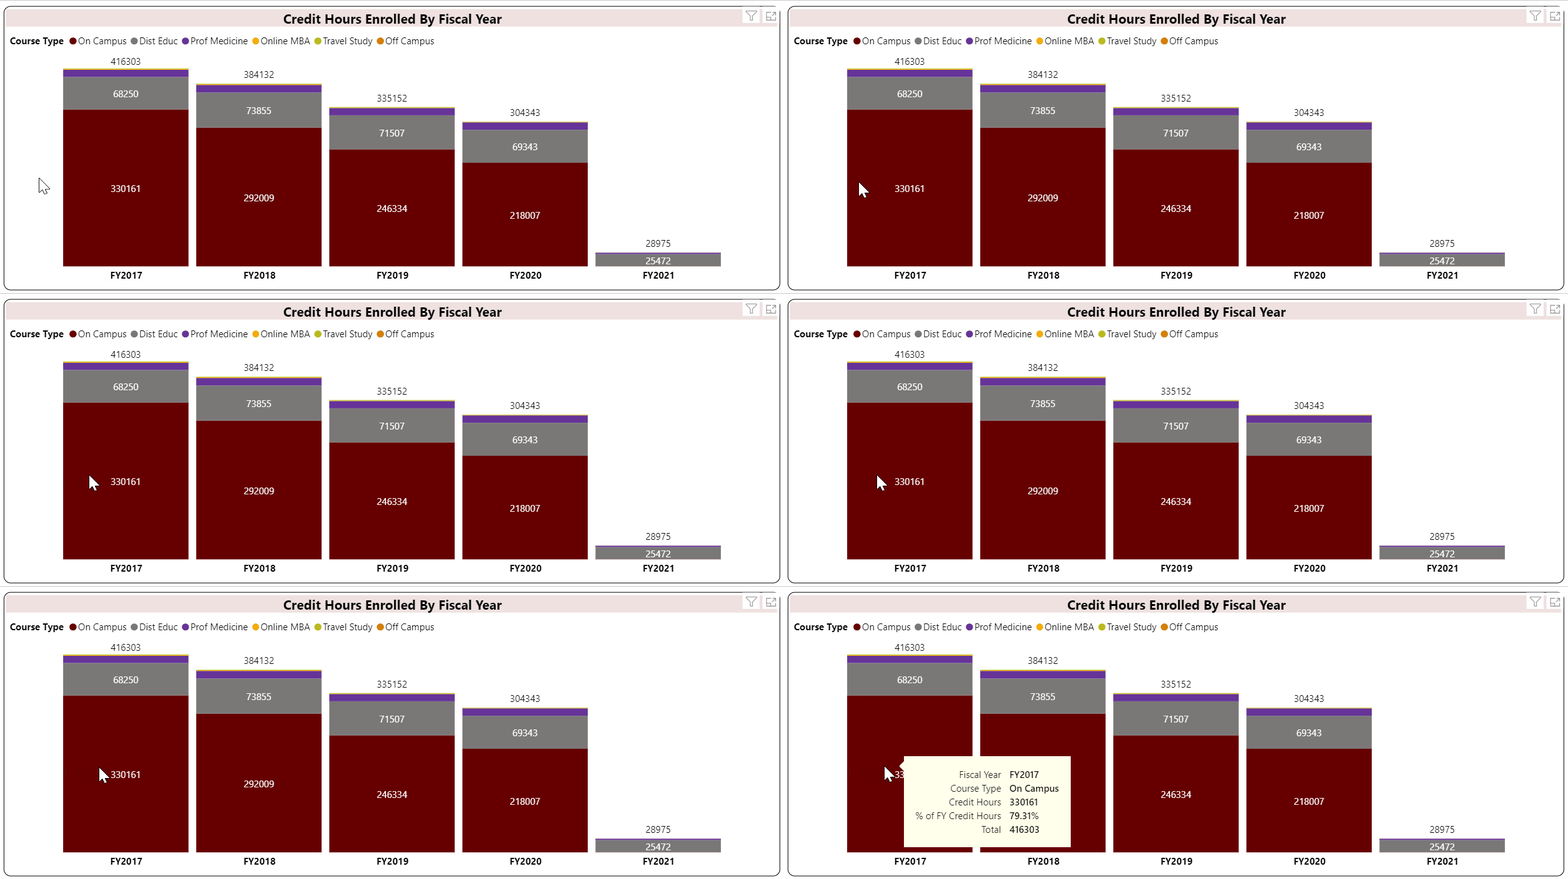
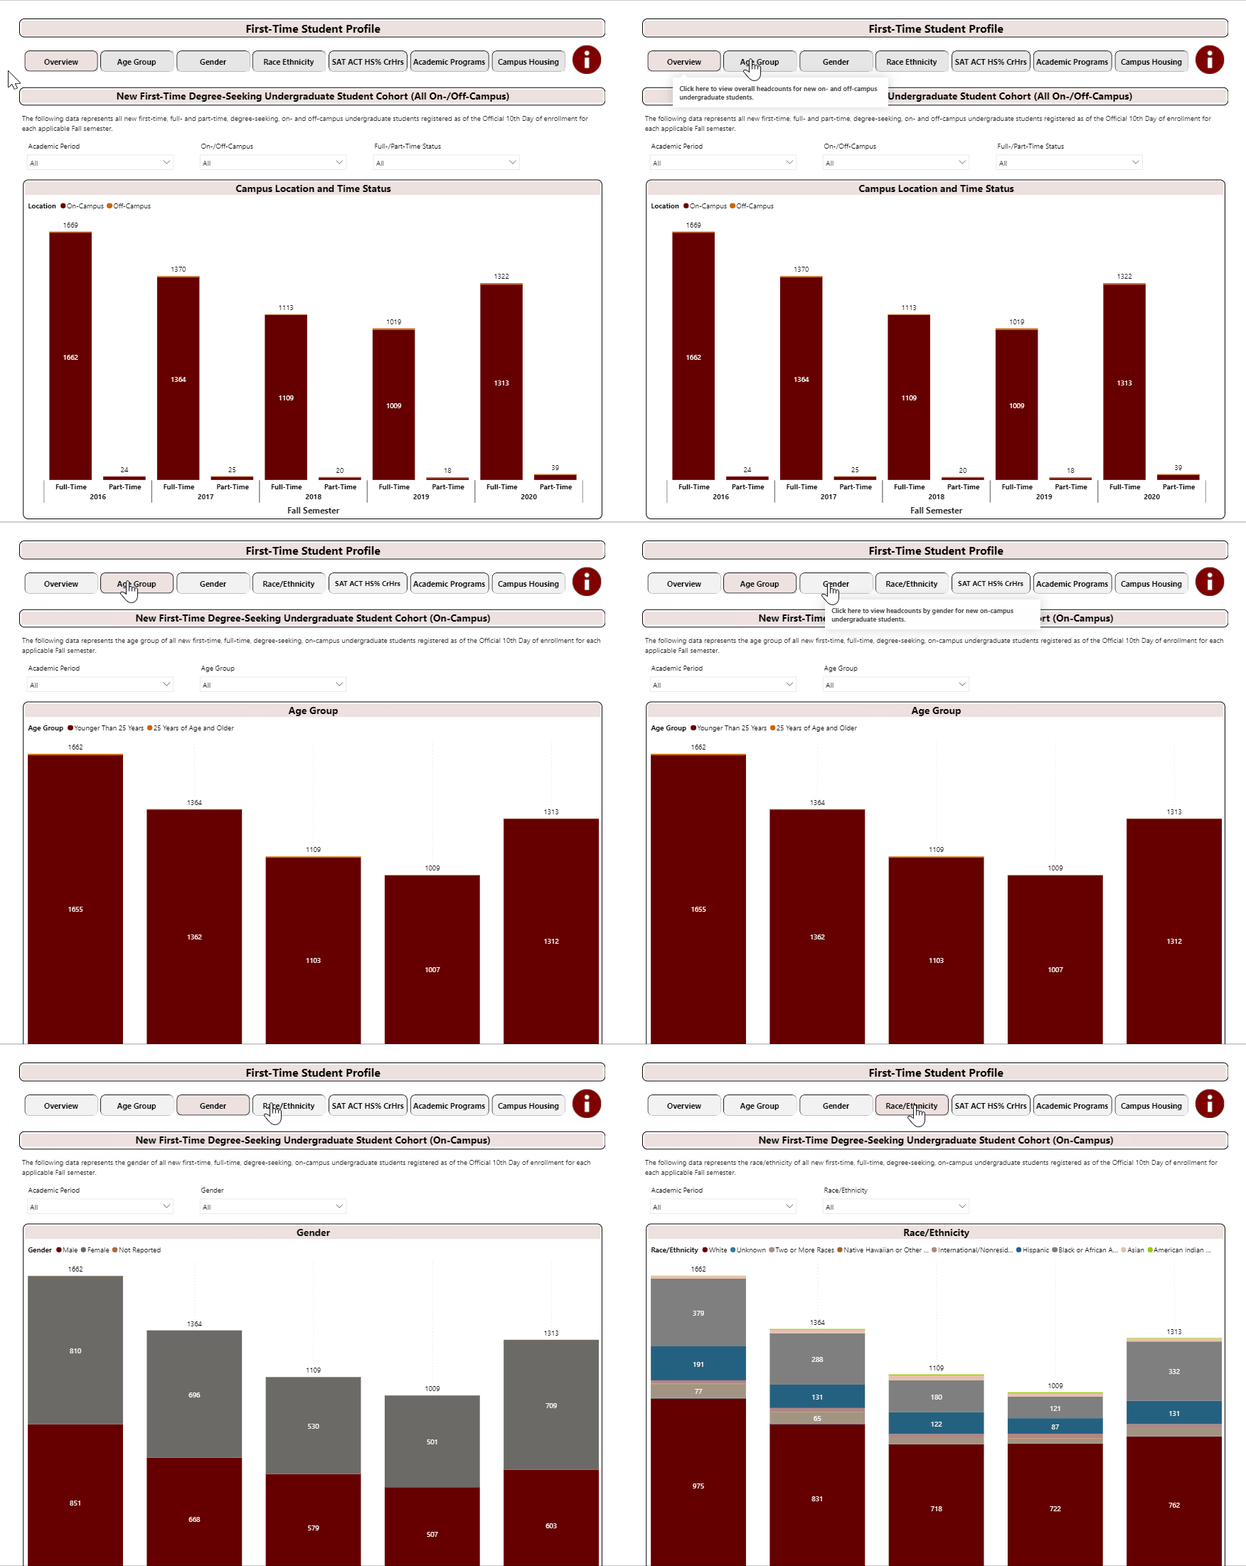
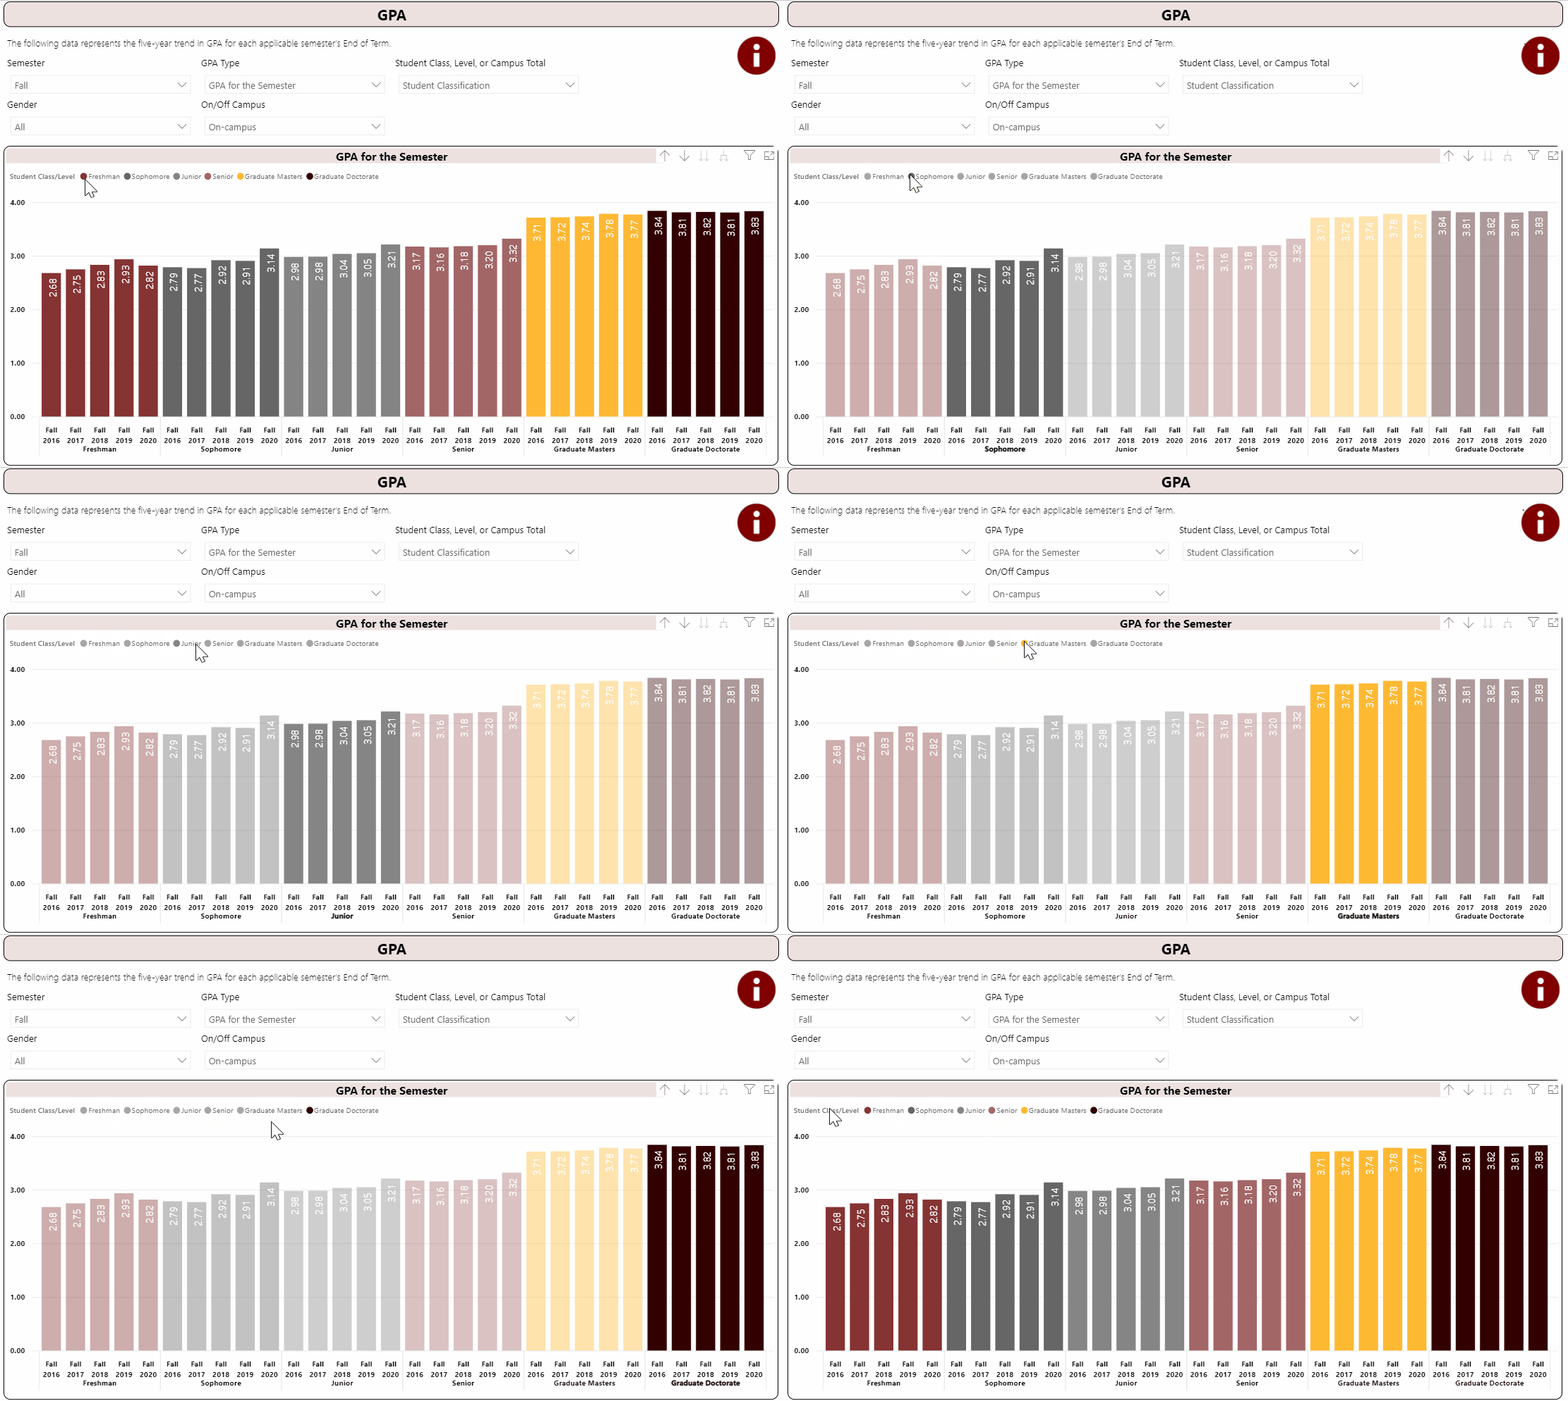
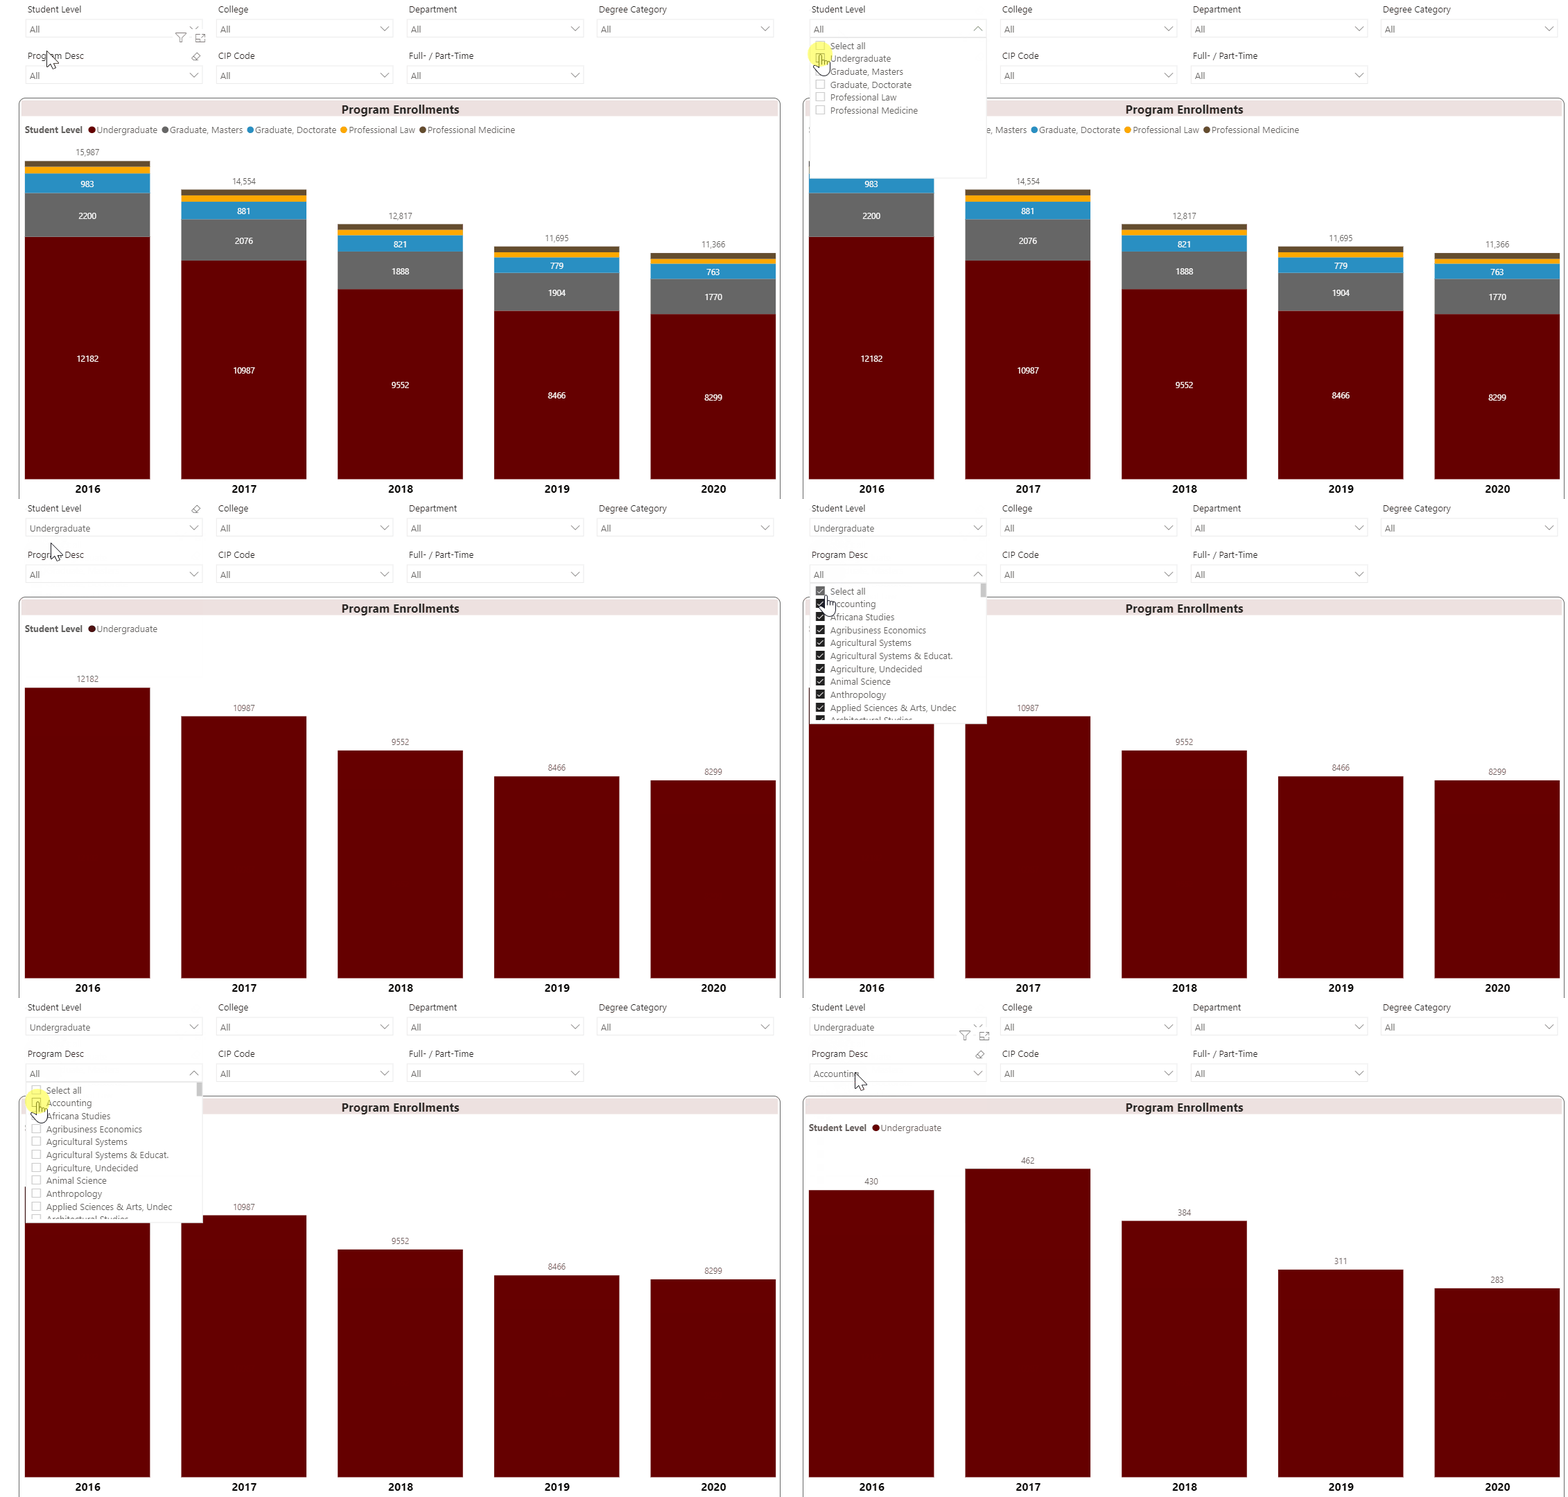
Using the Interactive Fact Book
Definitions of Terms Used
Budget
General Revenue Funds are those funds established to receive the major portion of the tax revenues and to pay the regular operating and administrative expenses of most State agencies. (Source: Comptroller's Uniform Statewide Accounting System-Procedure 09.10.20)
Educational Assistance Fund is a "Special State Fund" established July 1, 1989 by the Illinois Income Tax Act. This act establishes that a portion of the state income tax be provided as financial assistance to Elementary, Secondary, and Higher Education in the State of Illinois. (Source: Comptroller's Uniform Statewide Accounting System-Procedure 09.10.20)
University Income Funds are those funds which receive revenues such as course-specific fees and tuition at State-supported institutions of higher education. These funds are appropriated for the support, operation and improvement of State-supported colleges and universities. (Source: Comptroller's Uniform Statewide Accounting System-Procedure 09.10.20)
University Wide Services are those operations provided centrally that function for the entire University system as opposed to one specific unit.
Enrollments
Full-Time students are undergraduate students enrolled for 12 or more credit hours per semester and graduate students enrolled for 9 or more credit hours per semester. This is the Integrated Postsecondary Education Data System (IPEDS) definition. (Source: National Center for Education Statistics)
FTE (Full-Time Equivalent) is defined as an enrollment unit used to represent a student enrolled for a full course of study. It is calculated by dividing total credit hours generated by 15 for undergraduate students and by 12 for a graduate student for a semester FTE. This is the Integrated Postsecondary Education Data System (IPEDS) definition. (Source: National Center for Education Statistics)
Headcount is defined as the count of each student enrolled for one or more courses taken in a semester on the 10th day of the semester’s start.
Non-degree Seeking student is identified as a student enrolled in courses for credit who is not recognized by the institution as seeking a degree or formal award. This is the Integrated Postsecondary Education Data System (IPEDS) definition. (Source: National Center for Education Statistics)
Non-persisting indicates a student who is no longer enrolled at Southern Illinois University Carbondale in any program. Furthermore, this term is used to identify a student who is enrolled in a fall semester of an academic year and does not return the following fall semester.
Undeclared/Unclassified student is identified as a student who has enrolled in instructional courses but has not been officially accepted into one of the institution's authorized degree programs. This is the Integrated Postsecondary Education Data System (IPEDS) definition. (Source: National Center for Education Statistics)
Faculty and Staff
(Source: NCES and U.S. Bureau of Labor Statistics, 2010 SOC Definitions)
Business and Financial Operations Occupations include business operations specialists; financial specialists.
Community Service, Legal, Arts, and Media Occupations include counselors, social workers; lawyers and other legal support workers; arts, design, entertainment, sports, and media occupations.
Computer, Engineering, and Science Occupations include mathematical and science occupations; computer programmers; database administrators; architecture; engineering occupations.
Graduate Teaching Assistants assists faculty by performing teaching or teaching-related duties.
Healthcare Practitioners and Technical Occupations include healthcare practitioners and technical occupations.
Librarians, Curators, and Archivists include museum technicians and conservators; librarians and library technicians; audio-visual and multimedia collections specialists.
Management Occupations include top executives; advertising, marketing, promotions, public relations, and sales managers; operations specialties managers.
Natural Resources, Construction, and Maintenance Occupations include farming, fishing, and forestry occupations; construction and extraction occupations; installation, maintenance, and repair occupations.
Non-postsecondary Teaching Occupations include pre-school, primary, secondary, and special education school teachers; other teachers and instructors; other education, training, and library occupations.
Office and Administrative Support Occupations include financial clerks; information and record clerks; customer service representatives; library assistants, clerical; receptionists; dispatchers; postal service workers; secretaries and administrative assistants; statistical assistants.
Part-time Faculty include faculty with less than a 95 percent appointment at the University.
Postsecondary Teachers are reported by the following functions: instruction, instruction combined with research and/or public service, research, and public service.
Production, Transportation, and Material Moving Occupations include food processing workers; computer control programmers and operators; printing workers; plant and system operators; air transportation workers; motor vehicle operators.
Sales and Related Occupations include retail sales workers; sales supervisors; telemarketers.
Service Occupations include healthcare support occupations; protective service occupations; food prep and serving-related occupations; building and grounds cleaning and maintenance occupations; personal care and service occupations.
Other
CIP or Classification of Instructional Programs Code is a taxonomic coding scheme for secondary and postsecondary instructional programs. The CIP is the accepted Federal Government statistical standard on instructional program classifications and is used in a variety of education information surveys and databases. This is the Integrated Postsecondary Education Data System (IPEDS) Glossary of Terms.
CPI or Consumer Price Index is a measure of the average change in prices over time paid for food, clothing, shelter, transportation, and the other goods and services that people buy for day-to-day living. The U.S. Bureau of Labor Statistics compiles this index. (Source: 2008 HEPI, Commonfund Institute)
HEPI or Higher Education Price Index is a measure of the average relative level in the prices of a fixed market of goods and services purchased by colleges and universities. Government agencies and industry provide data to compile this index. (Source: 2008 HEPI, Commonfund Institute)
LAC Fees stands for “Legislative Audit Commission Guideline Fees.” LAC fees are course specific fees or other revenue derived from instructional activities. Examples of this type of fee include course specific fees, application fees, graduation fees, transcript fees, and library fines.
Student Credit Hour is a unit awarded a student for completing instruction of at least one hour per week for a semester (usually 15 weeks) or laboratory work of two to three hours per week for a semester. Quarter credits and short courses are prorated according to the above standard. (Source: Illinois Board of Higher Education)
Lower Division Students (undergraduate) is a student who has accumulated fewer than 60 semester credit hours (90 quarter credit hours) or the equivalent. (Source: Illinois Board of Higher Education)
Upper Division Students (undergraduate) is a student who has completed at least 60 semester credit hours (90 quarter credit hours) or an unclassified (irregular or special) student who has not been admitted to the graduate divison or to a professional college or school giving a post baccalaureate degree. (Source: Illinois Board of Higher Education)
Graduate I Students (graduate) is a student holding a bona fide bachelor’s degree who has been admitted to the graduate division or to a professional school either as a candidate for a master’s degree, advanced degree or certificate, or as an unclassified graduate student. (Source: Illinois Board of Higher Education)
Graduate II Students (graduate) is a student holding a bona fide master’s degree or an advanced certificate beyond the master’s degree who has been admitted to a doctoral program. Also, a student holding a bona fide bachelor’s degree who has been formally admitted to a doctoral program and who has completed at least 30 semester credit hours toward the doctoral degree is considered a Graduate II student. A Graduate II student can exist only in programs for which the institution offers an approved doctoral degree. (Source: Illinois Board of Higher Education)
Race/ethnicity (old definition): Categories used to describe groups to which individuals belong, identify with, or belong in the eyes of the community. The categories do not denote scientific definitions of anthropological origins. A person may be counted in only one group. The groups used to categorize U.S. citizens, resident aliens, and other eligible noncitizens are as follows: American Indian/Alaska Native; Asian/Pacific Islander; Black, non-Hispanic; Hispanic; White, non-Hispanic. (Source: National Center for Education Statistics)
Race/ethnicity (new definition effective Fall 2010): Categories developed in 1997 by the Office of Management and Budget that are used to describe groups to which individuals belong, identify with, or belong in the eyes of the community. The categories do not denote scientific definitions of anthropological origins. The designations are used to categorize U.S. citizens, resident aliens, and other eligible noncitizens.
Individuals are asked to designate ethnicity as
- Hispanic or Latino; or
- Not Hispanic or Latino.
Second, individuals are asked to indicate all races that apply among the following:
- American Indian or Alaska Native;
- Asian;
- Black or African American;
- Native Hawaiian or Other Pacific Islander;
- and White.
- (Source: National Center for Education Statistics)
